Key Watcher Introduction
Overview
Key Watcher is a dashboard developed during the 2024/2025 academic year at Fontys University of Applied Sciences. The project aims to provide Bas World with a user-friendly interface to monitor and analyze incoming data streams to their web application. Bas World is a leading platform for buying and selling commercial vehicles and equipment worldwide, with over 60 years of experience and a global reach.
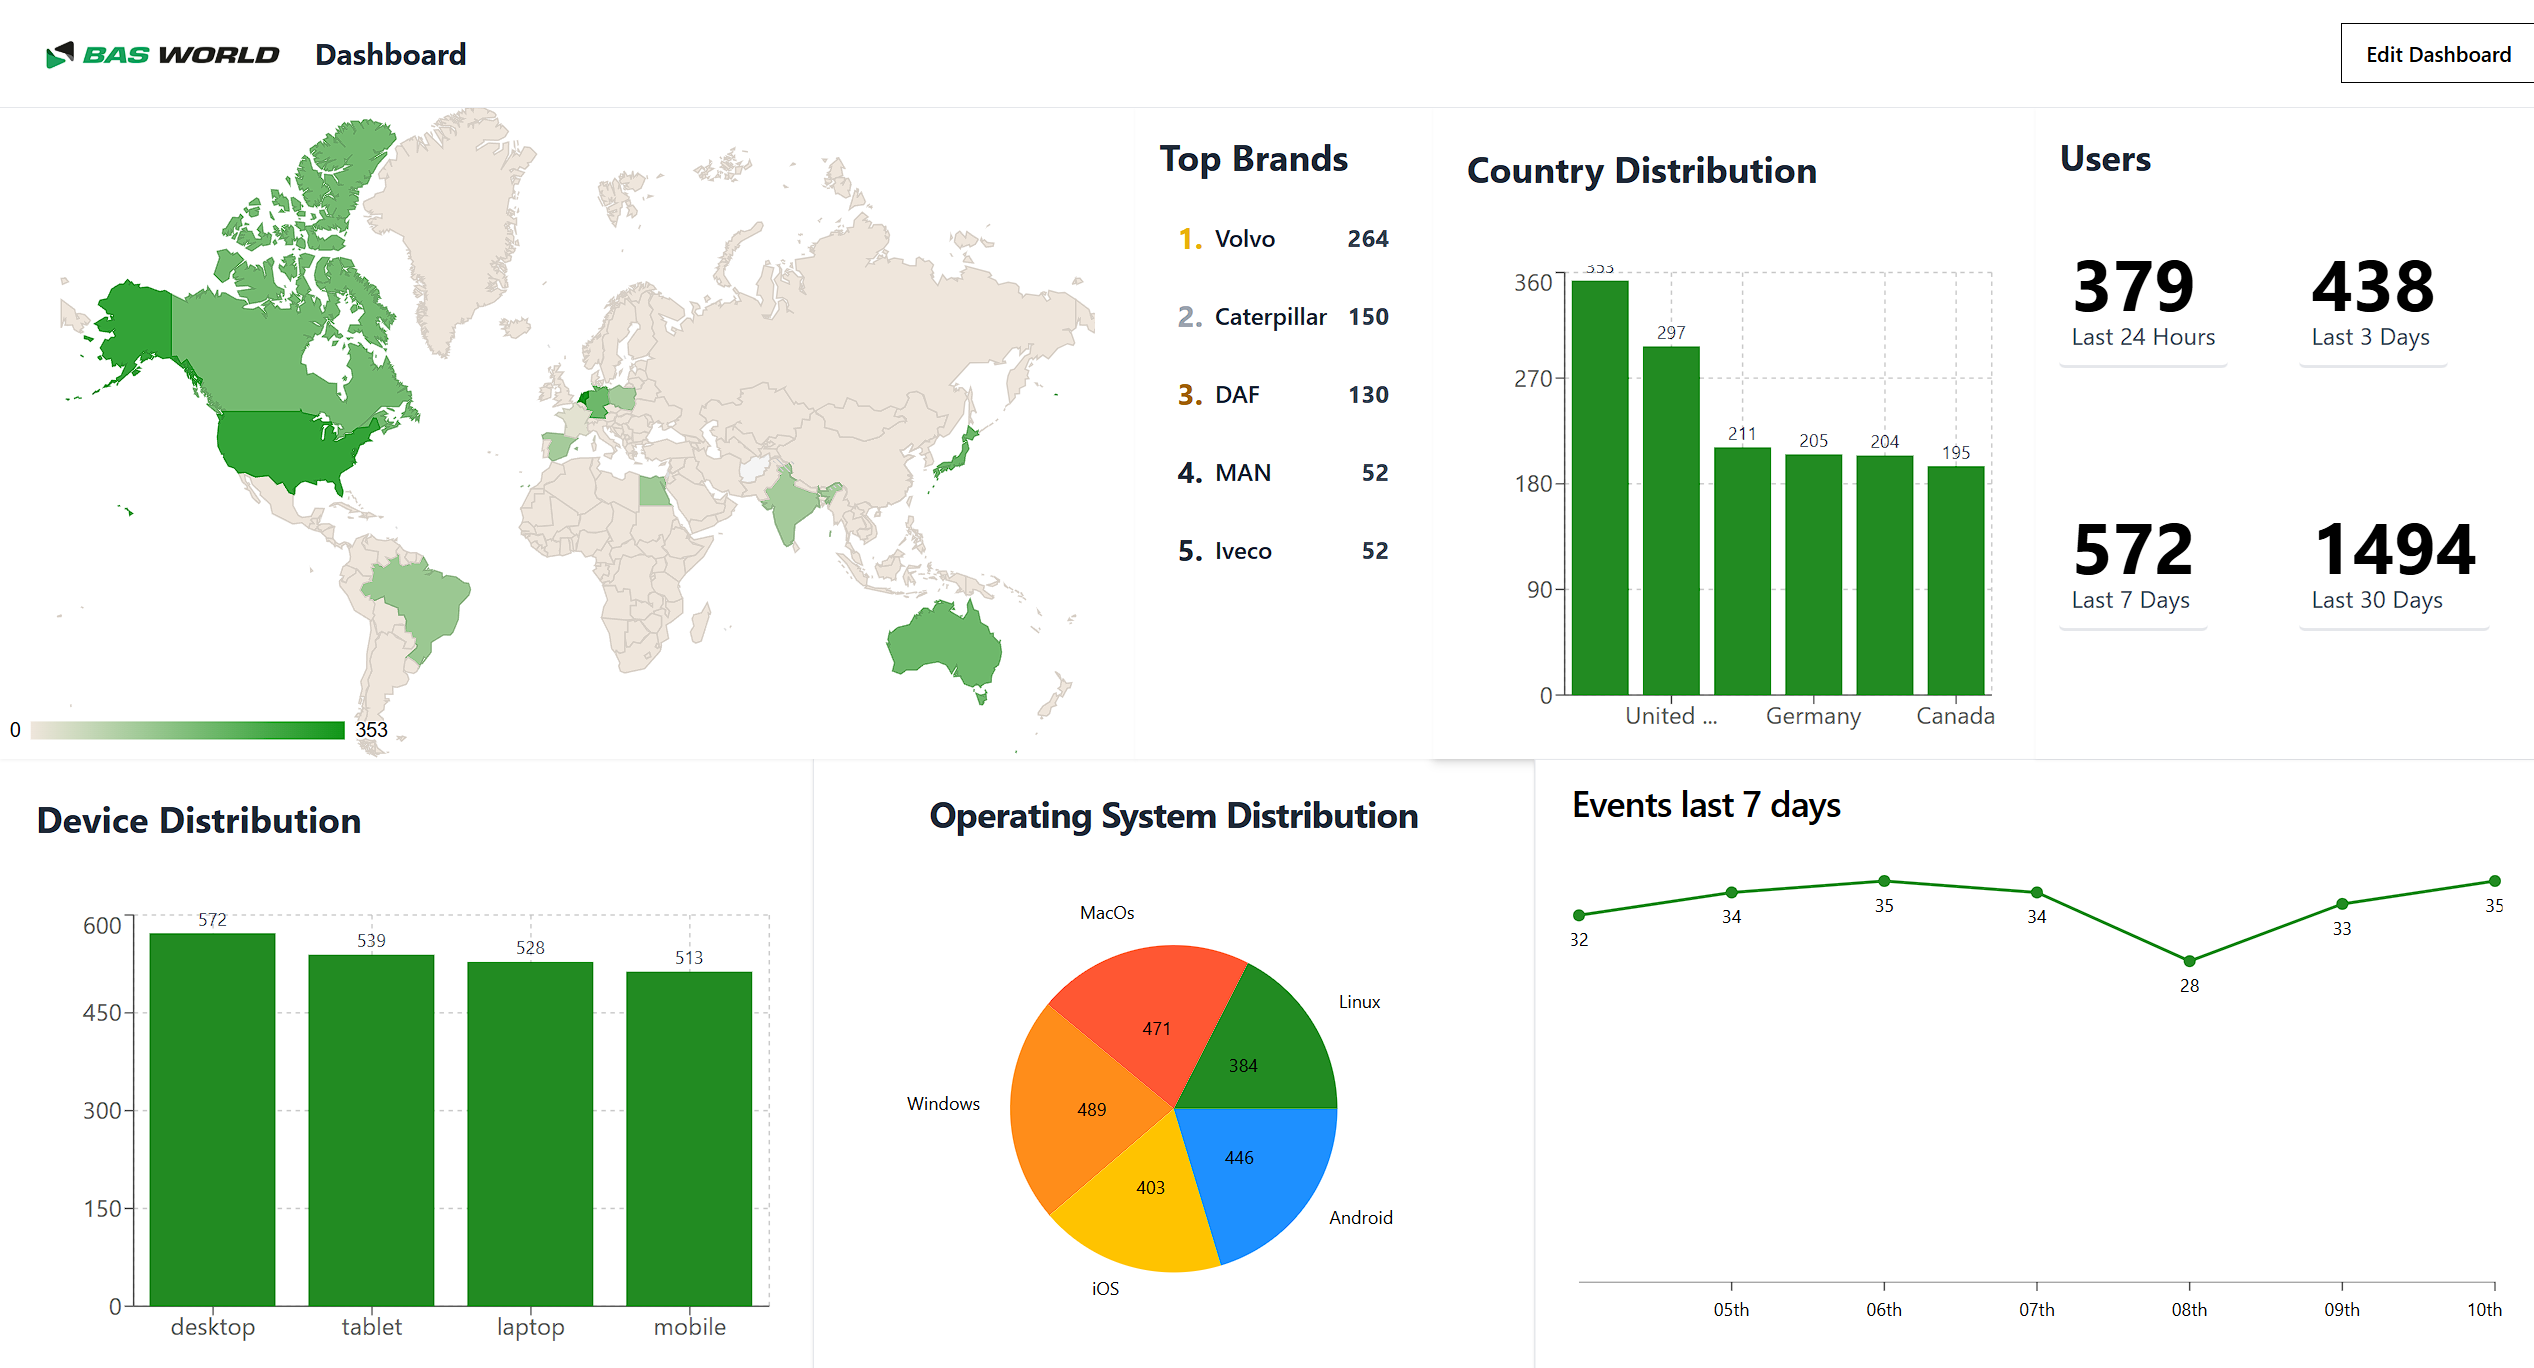
The primary goal of this Dashboard is to offer a clear, user-friendly interface to display incoming data streams to the Bas World web application. The displayed data is structured according to the JSON format of the incoming information, ensuring consistency and accuracy in how the data is visualized and interpreted.
Objectives
- Data Visualization: Provide a structured and intuitive visualization of the incoming data, making it easier for users to monitor and analyze critical metrics.
- Widget-Based Architecture: The Dashboard is modular, built using widgets, which allows flexibility in design, functionality, and customization.
- User-Friendly Design: Ensure that the Dashboard is easy to navigate and understand, even for users without a technical background.
- Ease of Maintenance: Facilitate updates and modifications to the Dashboard to accommodate evolving requirements with minimal effort.
Features
-
Dynamic Data Rendering:
- Displays real-time or near-real-time data streams received by the Bas World application.
- Extracts and formats data directly from the JSON structure for easy comprehension.
-
Widget-Based Dashboard:
- A flexible and customizable approach allows users to add, remove, or rearrange widgets to suit their specific needs.
- Each widget is designed to focus on a particular metric or data set.
-
Scalable and Modular Design:
- The architecture supports scalability, ensuring the Dashboard can grow with increasing data volumes.
- Modular components make development and maintenance efficient.
-
Customizable Views:
- Tailored views for different user roles or departments within Bas World.
- Filters and settings enable personalized data visualization.